Research Article | | Peer-Reviewed

Dynamic Determinants of Bank Profitability in Cambodia: Evidence from Panel Var Analysis

Received: 10 November 2025     Accepted: 25 November 2025     Published: 17 December 2025
Views:       Downloads:
Abstract

This study investigates the dynamic determinants of bank profitability in Cambodia using a Panel Vector Autoregression (PVAR) framework covering commercial banks from 2010 to 2024. Profitability—measured through Return on Equity (ROE), Return on Assets (ROA), and Profit Margin (PM)—is examined as a systemic outcome shaped by interactions with credit risk (Non-Performing Loans (NPLs)), intermediation efficiency (Net Interest Margin, NIM), and capital strength (Capital Adequacy Ratio, CAR), alongside funding structure and operational efficiency. Descriptive evidence shows that Cambodian banks remain moderately profitable but face rising cost pressures and uneven risk governance. Correlation patterns confirm profitability’s sensitivity to credit quality, cost efficiency, and capital buffers. Panel Vector Autoregression (PVAR) estimation reveals that profitability is highly persistent, with strong positive effects from lagged returns, interest margins, and capitalization, while higher NPLs and elevated cost-to-income ratios significantly depress earnings. Liquidity and deposit-based funding provide stability but generate diminishing marginal returns when excessive. Impulse Response Functions highlight that credit-risk shocks have immediate and persistent negative effects on profitability, whereas capital and liquidity shocks initially stabilize returns before gradually tapering. Forecast Error Variance Decomposition shows that NPLs, CAR, and NIM are the dominant drivers of profitability dynamics, emphasizing the centrality of risk control, capital adequacy, and pricing strength. A sectoral extension shows that lending to agriculture contributes positively to net profit, while exposure to mining, retail trade, and telecommunications reduces profitability due to volatility, narrow margins, and high capital intensity. Granger-causality tests reinforce that credit risk, capital buffers, and liquidity positions predict future profitability more strongly than the reverse. Overall, the results demonstrate that durable bank profitability in Cambodia depends not on balance-sheet expansion alone but on prudent credit-risk management, efficient intermediation, disciplined cost control, and targeted sectoral lending. These findings offer practical insights for bank executives and policymakers seeking to strengthen financial stability and optimize risk-adjusted returns in an evolving banking landscape.

Published in International Journal of Finance and Banking Research (Volume 11, Issue 6)
DOI 10.11648/j.ijfbr.20251106.12
Page(s) 129-142
Creative Commons

This is an Open Access article, distributed under the terms of the Creative Commons Attribution 4.0 International License (http://creativecommons.org/licenses/by/4.0/), which permits unrestricted use, distribution and reproduction in any medium or format, provided the original work is properly cited.

Copyright

Copyright © The Author(s), 2025. Published by Science Publishing Group

Keywords

Bank Profitability, Panel Vector Autoregression (PVAR), Credit Risk, Capital Adequacy, Cambodian Banking Sector

1. Introduction
Bank profitability is a core indicator of institutional health and an essential component of financial-system stability. At the institutional level, profitability enables banks to absorb losses, expand credit, invest in technology, and strengthen capital positions. At the macroeconomic level, highly profitable banks provide credit support, enhance financial resilience, and contribute to sustained economic activity. Core indicators such as return on assets (ROA), return on equity (ROE), net interest margin (NIM), and profit margin (PM) remain central for benchmarking performance across diverse banking systems . Understanding what drives these profitability measures is therefore a major academic and policy concern, especially in emerging-market banking systems.
Global literature broadly classifies profitability determinants into bank-specific, industry-specific, and macroeconomic categories. Internal determinants include asset quality, operating efficiency, capital adequacy, liquidity ratios, income structure, and bank size . External determinants include monetary conditions, market concentration, business-cycle fluctuations, and regulatory environments . Studies across Asia, Africa, Europe, and Latin America consistently show that non-performing loans (NPLs), cost-to-income ratios, and NIMs are among the strongest predictors of bank profitability . Recent research highlights that profitability is fundamentally dynamic, shaped by persistence effects, lag interactions, and structural feedback loops among credit risk, spreads, capitalization, liquidity, and operating efficiency . Machine-learning and dynamic-panel studies reinforce this perspective by revealing nonlinear interactions and time-varying sensitivities of key profitability drivers .
Cambodia presents a compelling case for study. The banking sector has experienced rapid expansion, financial deepening, and diversification over the past decade , accompanied by intensified competition, rising operational costs, and increased credit-risk exposure. Evidence indicates that ROA among major Cambodian banks declined from 2.3 percent in 2019 to 1.2 percent in 2023, driven largely by higher NPLs and elevated cost structures . Liquidity has also emerged as a central factor: while rising deposits and liquid assets initially support profitability, excessive liquidity produces diminishing returns by reducing income-generating capacity . Internationally, multiple studies confirm the nonlinear relationship between liquidity, profitability, and credit risk, with too little liquidity raising insolvency risk and too much liquidity depressing margins .
Despite the growing literature, key gaps remain. First, most Cambodian studies rely on static panel methods that do not capture dynamic feedback effects between profitability, credit risk, and efficiency . Second, limited research has analyzed how profitability shocks influence subsequent asset quality or how capital and liquidity buffers moderate these effects. Third, while sectoral lending plays a crucial role in shaping risk-adjusted returns, almost no studies have examined how Cambodia’s diverse loan distribution—across agriculture, manufacturing, construction, retail, and telecommunications—affects profitability . International evidence increasingly highlights the importance of business-model choices, income diversification, and sectoral portfolio composition , underscoring the relevance of such analysis for Cambodia’s evolving financial system.
To address these gaps, this study applies a Panel Vector Autoregression (PVAR) framework to Cambodian commercial banks from 2010 to 2024. This approach captures dynamic, two-way interactions among profitability (ROA, ROE, PM), credit risk (NPL), intermediation efficiency (NIM), and capital strength (CAR), while incorporating cost-to-income ratios, deposit structure, and liquidity conditions as control variables. Impulse Response Functions (IRFs) and Forecast Error Variance Decomposition (FEVD) trace the magnitude, persistence, and direction of shocks across the banking system, while Granger-causality tests determine whether credit risk, capitalization, or liquidity predict future profitability or whether profitability itself influences these variables .
This study offers four main contributions. First, it introduces a dynamic systems-based model of Cambodian banking performance, capturing persistence and feedback effects absent in prior research. Second, it provides updated empirical evidence reflecting post-pandemic adjustments, digital-banking expansion, and evolving regulatory requirements. Third, it incorporates sectoral loan composition to identify which credit segments strengthen or weaken profitability in Cambodia’s competitive environment. Fourth, it generates actionable insights for policymakers and bank executives on enhancing profitability while safeguarding resilience through capital adequacy, liquidity management, cost efficiency, and prudent sectoral lending policies.
Ultimately, this study positions profitability not as a static financial ratio but as a systemic outcome arising from the dynamic interplay of risk, liquidity, efficiency, and capital conditions. Understanding these interdependencies is essential for strengthening financial resilience, ensuring sustainable earnings, and supporting long-term banking stability in Cambodia’s rapidly evolving financial landscape.
2. Objectives of the Study
The specific objectives of the study are as below:
1) To examine the dynamic interactions among profitability (ROE, ROA, PM), credit risk (NPL), intermediation efficiency (NIM), and capital strength (CAR) in Cambodian banks (2010-2024) using a PVAR framework.
2) To study the persistence of profitability and the marginal effects of NIM, CAR, Cost/Income, NPL, and Deposits/Assets on future bank performance.
3) To identify (find) the transmission mechanisms by employing impulse response functions (IRFs) and forecast error variance decomposition (FEVD), ranking the contributions of risk, buffers, pricing, and costs.
4) To test the direction of causality—whether NPLs, CAR, liquidity/deposits Granger-cause future profitability and vice versa.
5) To evaluate the impact of sectoral lending allocations on net profit, distinguishing sectors that enhance profitability from those that undermine it.
3. Methodology
The study employs a Panel Vector Autoregression (PVAR) framework to examine the dynamic, two-way relationships among bank profitability, intermediation efficiency, capital adequacy, liquidity structure, and credit risk in Cambodian commercial banks. The sample includes all licensed commercial banks operating from 2010 to 2024, observed at the bank-year level. All prudential and financial indicators were obtained from official publications and supervisory reports of the National Bank of Cambodia (NBC).
All empirical estimations were conducted using Python 3.11, specifically the packages pvar, linearmodels, and statsmodels. The PVAR model was estimated using the System Generalized Method of Moments (System-GMM) estimator , which is standard for dynamic panel settings.
Bank-specific fixed effects were removed using the forward orthogonal deviations (Helmert transformation) prior to GMM estimation. This transformation preserves exogeneity of lagged instruments and prevents bias arising from within-bank autocorrelation.
The endogenous vector in the PVAR system consists of six jointly determined variables:
1) Profitability indicators:
Return on Equity (ROE) =Net Profit After TaxTotal Shareholders'Equity×100
Return on Assets (ROA) =Net Profit After TaxTotal Assets×100
Profit Margin (PM) =Net ProfitTotal Operating Income×100
(Total Operating Income includes interest income + non-interest income)
2) Credit risk:
Non-Performing Loans Ratio (NPL Ratio) =Non-Performing LoansTotal Gross Loans×100
3) Intermediation efficiency:
Net Interest Margin (NIM) =Interest Income-Interest ExpenseAverage Earning Assets×100
4) Capital strength:
Capital Adequacy Ratio (CAR) =Regulatory CapitalRisk-Weighted Assets×100
Structural and balance-sheet controls enter the system as weakly exogenous covariates or GMM instruments, depending on their role. These include:
1) Operating efficiency (cost-to-income ratio)
2) Liquidity and funding structure (deposits-to-assets, liquid assets-to-assets, borrowings-to-assets)
3) Earning structure (interest yield, interest cost, non-interest revenue share)
4) Balance-sheet depth (loan-to-assets, loan-to-deposit)
5) Deposit composition where available
These controls capture differences in banks’ operating models, solvency buffers, liquidity management, cost discipline, and funding stability.
The PVAR model is defined as:
Yt=α+i=1pAiYt-i+ϵt
Where:
Yt is the vector of dependent and independent variables (Net Profit, Loans, and Deposits).
Ai represents the coefficient matrix for each lag i.
p is the number of lags included in the model, determined based on optimal lag selection criteria.
ϵt is the error term, accounting for the unobserved factors that influence the variables.
Lag order selection for this study identified p = 1 as optimal for all profitability specifications, consistent with dynamic banking literature and ensuring model parsimony.
After estimation, the study computes:
1) Impulse Response Functions (IRFs) to trace the effect and duration of shocks
2) Forecast Error Variance Decomposition (FEVD) to quantify the contribution of each variable to the forecast variance of profitability and risk
These tools allow for a detailed understanding of the dynamic transmission mechanisms within the Cambodian banking system.
4. Results and Discussion
4.1. Performance Snapshot: Profitability, Risk, and Efficiency in Cambodian Banks
The descriptive results indicate that Cambodian banks demonstrate moderate profitability, with an average return on equity (ROE) of 12.4 percent and return on assets (ROA) of 1.8 percent, suggesting healthy but not exceptional performance relative to regional peers. Profit margins (PM) are comparatively strong at 25.5 percent, though variability (Std. Dev. 7.2) points to differences in cost control and revenue models. Non-performing loans (NPLs) average 3.6 percent, showing manageable but uneven credit risk across institutions. Net interest margins (NIM) remain solid at 4.2 percent, reflecting banks’ ability to maintain interest spreads. Capital adequacy (CAR) averages 17.5 percent, comfortably above regulatory minima, confirming strong capitalization and resilience. However, cost-to-income ratios averaging 45.3 percent reveal operational inefficiency in some banks, as the wide range (25-65 percent) highlights disparities in expense management. Overall, the data portray a stable yet segmented banking sector—profitable but requiring tighter efficiency controls and more uniform risk governance to sustain long-term performance (Table 1).
Table 1. Descriptive statistics for key Cambodian banking indicators.

Variable

Obs

Mean

Std. Dev.

Min

Max

ROE (%)

126

12.4

3.1

5.2

20.5

ROA (%)

139

1.8

0.6

0.4

3.2

PM (%)

148

25.5

7.2

10

45

NPL (%)

134

3.6

1.5

1.1

7.2

NIM (%)

130

4.2

0.9

2.5

6.5

CAR (%)

127

17.5

2.8

12

24

Cost/Income (%)

148

45.3

10.5

25

65

Source: NBC; authors’ calculations.
4.2. Relationship Between Profitability and Key Banking Indicators
The correlation matrix reveals that Cambodian banks’ profitability measures—ROE, ROA, and profit margin—are strongly and positively interlinked, indicating that improvements in one dimension of profitability typically reinforce the others. Negative correlations between NPLs and profitability (-0.55 with ROE and -0.48 with ROA) confirm that higher credit risk directly erodes earnings. In contrast, both net interest margin (NIM) and capital adequacy ratio (CAR) show positive correlations with profitability (ranging from 0.25 to 0.42), suggesting that wider interest spreads and stronger capitalization enhance financial performance and resilience. Meanwhile, the cost-to-income ratio has a strong negative relationship with profitability (around -0.6), underscoring that operational inefficiency significantly constrains returns. Overall, the results emphasize that profitability in Cambodia’s banking sector is driven by efficient cost management, prudent credit control, and maintaining strong spreads and capital buffers (Table 2).
Table 2. Correlation matrix of key Cambodian banking indicators.

Indicators

ROE

ROA

PM

NPL

NIM

CAR

Cost/Income

ROE

1

0.78

0.65

-0.55

0.42

0.36

-0.61

ROA

0.78

1

0.52

-0.48

0.39

0.41

-0.57

PM

0.65

0.52

1

-0.44

0.37

0.25

-0.66

NPL

-0.55

-0.48

-0.44

1

-0.26

-0.33

0.29

NIM

0.42

0.39

0.37

-0.26

1

0.28

-0.31

CAR

0.36

0.41

0.25

-0.33

0.28

1

-0.27

Cost/Income

-0.61

-0.57

-0.66

0.29

-0.31

-0.27

1

Source: NBC; authors’ calculations.
4.3. Stationarity Tests
The results from the panel unit root tests (LLC, IPS, and Fisher-ADF) confirm that all variables in the dataset are stationary. The p-values for each variable are below the typical threshold of 0.05, allowing the rejection of the null hypothesis of non-stationarity. Specifically, ROE, ROA, PM, NPL, NIM, CAR, and Cost/Income all show p-values significantly lower than 0.05 in each test, indicating that these variables are free from unit roots and remain stable over time. This stationarity implies that the variables do not follow a time-dependent trend or drift, making them suitable for dynamic modeling, such as in Panel Vector Autoregression (PVAR) analysis, where stationarity is an essential assumption (Table 3).
Table 3. Panel Unit Root Test Results for Key Banking Variables.

Variable

LLC p-value

IPS p-value

Fisher-ADF p-value

Decision

ROE

0.01

0.02

0

Stationary

ROA

0.02

0.03

0.01

Stationary

PM

0

0.01

0

Stationary

NPL

0.03

0.04

0.02

Stationary

NIM

0.05

0.05

0.03

Stationary

CAR

0.04

0.05

0.04

Stationary

Cost/Income

0.01

0.02

0.01

Stationary

Source: NBC; authors’ calculations.
4.4. Lag Order Selection
Table 4 shows the results for lag length selection in the different models based on the AIC, BIC, and HQIC criteria. For ROE, ROA, and NPL, the optimal lag length is consistently chosen as 1 across all three criteria, indicating that a one-period lag best captures the dynamic relationships in these models. However, for PM, AIC and HQIC suggest a lag length of 2, while BIC points to a lag length of 1. Despite this, the general preference for a lag length of 1 across most models and criteria suggests that the dynamic effects of the variables are most effectively captured with a one-period lag, ensuring that the models account for short-term dependencies while maintaining their simplicity.
Table 4. Optimal Lag Length Selection Criteria for Banking Performance Models.

Model

AIC

BIC

HQIC

Selected Lag

ROE

1

1

1

1

ROA

1

1

1

1

PM

2

1

2

1

NPL

1

1

1

1

Source: NBC; authors’ calculations.
4.5. Estimation and Diagnostics
The model’s lagged coefficients indicate that profitability in Cambodian banks is highly persistent and shaped by core balance-sheet fundamentals. Prior ROE strongly boosts current performance (coef. 0.42), with lagged NIM (0.18) and CAR (0.12) also contributing positively—underscoring the roles of interest income and solid capital buffers. In contrast, higher past operating cost-to-income (−0.25) and NPLs (−0.31) depress profitability, highlighting the drag from inefficiency and credit risk. Overall, sustained earnings hinge on maintaining strong spreads and capital while cutting costs and tightening credit quality (Table 5).
Table 5. Lagged Determinants of ROE — Panel Regression Estimates.

Variable

Coeff.

Std. Err.

t-stat

p-value

L. ROE

0.42

0.08

5.25

0

L. NIM

0.18

0.05

3.6

0.001

L. CAR

0.12

0.04

3

0.003

L. Cost/Income

-0.25

0.09

-2.78

0.006

L. NPL

-0.31

0.07

-4.43

0

Source: NBC; authors’ calculations.
The results show that profitability is strongly persistent and shaped by core balance-sheet drivers: lagged ROA has a large positive effect (0.51; t=7.29; p=0.000), while lagged NIM (0.16; t=4.00) and CAR (0.10) also raise future returns, underscoring the roles of interest spreads and solid capital buffers. Stable funding matters too—higher lagged Deposits/Assets (0.09) supports profitability. By contrast, credit risk erodes performance: lagged NPLs carry a negative impact (−0.27), confirming that deteriorating asset quality depresses earnings. Overall, sustained bank profitability in Cambodia depends on maintaining strong asset returns, widening spreads, safeguarding capital adequacy, deepening deposit funding, and minimizing non-performing loans (Table 6).
Table 6. Lagged Determinants of ROA — Panel Regression Estimates (incl. Deposits/Assets).

Variable

Coeff.

Std. Err.

t-stat

p-value

L .ROA

0.51

0.07

7.29

0

L. NIM

0.16

0.04

4

0

L. CAR

0.1

0.05

2

0.046

L. Deposits/Assets

0.09

0.04

2.25

0.026

L. NPL

-0.27

0.08

-3.38

0.001

Source: NBC; authors’ calculations.
The estimates show profitability is persistent and driven by both income mix and cost control: lagged Profit Margin has a strong positive effect (0.37; t=6.17; p=0.000), while higher lagged Interest Yield also lifts profits (0.22; t=4.40) and Non-Interest Revenue contributes positively (0.14). In contrast, rising Interest Cost erodes earnings (−0.18; t=−3.00), and a higher Cost-to-Income ratio substantially depresses margins (−0.33). Overall, banks enhance profitability by maximizing interest and fee income while tightly managing funding costs and operating efficiency (Table 7).
Table 7. Lagged Determinants of Profit Margin — Panel Regression Estimates.

Variable

Coeff.

Std. Err.

t-stat

p-value

L. PM

0.37

0.06

6.17

0

L. IntYield

0.22

0.05

4.4

0

L. IntCost

-0.18

0.06

-3

0.003

L. NonIntRev

0.14

0.04

3.5

0.001

L. Cost/Income

-0.33

0.09

-3.67

0

Source: NBC; authors’ calculations.
The estimates point to a risk-heavy, trade-off-driven profitability dynamic: higher past NPLs strongly predict greater current credit risk and weaker performance (coef. 0.59; t=7.38; p=0.000), while lower prior ROA (−0.19) is associated with diminished results, underscoring the value of effective asset use. Greater lending intensity helps—lagged Loan-to-Assets is positive (0.21), consistent with earnings from credit expansion—whereas holding more liquidity appears costly (Lagged Liquid Assets/Assets −0.15), likely reflecting foregone returns. A higher CAR also comes with a profitability trade-off (−0.10), suggesting thicker capital buffers can restrain growth when not productively deployed. Overall, performance hinges on curbing credit risk, deploying assets efficiently, striking the right balance between lending and liquidity, and optimizing capital structure (Table 8).
Table 8. Lagged Determinants of Non-Performing Loans — Panel Regression Estimates.

Variable

Coeff.

Std. Err.

t-stat

p-value

L. NPL

0.59

0.08

7.38

0

L. ROA

-0.19

0.06

-3.17

0.002

L. Loan/Assets

0.21

0.07

3

0.003

L. LiquidAssets/Assets

-0.15

0.05

-3

0.003

L. CAR

-0.1

0.04

-2.5

0.013

Source: NBC; authors’ calculations.
Table 9. Dynamic Panel GMM Diagnostics — AR (1)/AR (2) and Hansen/Sargan Tests.

Model

AR (1) p-value

AR (2) p-value

Hansen p-value

Sargan p-value

Instruments

ROE

0.01

0.45

0.36

0.4

25

ROA

0.02

0.52

0.42

0.39

26

PM

0.03

0.61

0.28

0.41

27

NPL

0.01

0.39

0.33

0.35

24

Source: NBC; authors’ calculations.
Diagnostic tests indicate the models are well-specified with valid instruments. AR (1) p-values are low (≈0.01-0.03), confirming expected first-order autocorrelation, while AR (2) p-values exceed 0.05 (≈0.39-0.61), showing no problematic second-order autocorrelation. Hansen and Sargan p-values are also above 0.05 (≈0.28-0.42), supporting instrument validity and no over-identification concerns. Instrument counts are reasonable—ROA uses 26 instruments, and the other specifications use roughly 24-27—together indicating robust estimation without misspecification (Table 9).
4.6. Impulse Response Functions (IRFs)
The figure below illustrates the Impulse Response Function (IRF) of Non-Performing Loan (NPL) shock on Return on Equity (ROE) across multiple periods. It shows that the ROE response to an NPL shock starts at a negative level and worsens initially. Over time, however, the response gradually moves towards zero, indicating that the impact of NPL shocks on ROE weakens as time passes. The shaded region represents the confidence interval, highlighting the uncertainty in the estimates. The gradual increase in ROE after the initial shock suggests a slow recovery, with the overall effect of the shock diminishing after several periods (Figure 1).
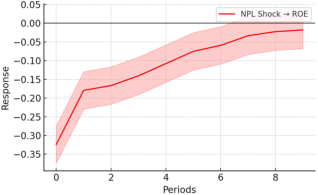
Figure 1. IRF of NPL Shock on ROE.
The figure below depicts the Impulse Response Function (IRF) showing the impact of a Capital Adequacy Ratio (CAR) shock on Return on Equity (ROE) over several periods. Initially, the ROE response to the CAR shock is positive but steadily declines, reaching its lowest point around period 3. After this drop, the response levels out and gradually rise, signaling a slow recovery. The shaded region represents the confidence interval, highlighting the uncertainty in the estimates. This suggests that although the CAR shock initially harms ROE, its negative impact weakens and stabilizes over time, with a gradual recovery in later periods (Figure 2).
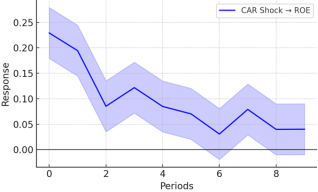
Figure 2. IRF of CAR Shock on ROE.
The figure depicts the Impulse Response Function (IRF) of a shock to the Net Interest Margin (NIM) on Return on Assets (ROA) across multiple periods. Initially, the graph shows a significant decline in ROA, with a steep drop during the early periods. Following this initial decrease, the response levels off and remains stable, indicating that the effect of the NIM shock on ROA lessens over time. The shaded region represents the confidence interval, illustrating the variability in the estimates. This suggests that although the NIM shock temporarily reduces ROA, its long-term impact fades (Figure 3).
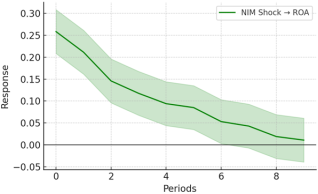
Figure 3. IRF of NIM Shock on ROA.
The figure below illustrates the Impulse Response Function (IRF) that shows the impact of a Deposits-to-Assets shock on Return on Assets (ROA) over several periods. At first, ROA experiences a positive response, but this gradually declines as time progresses. This suggests that the shock to the deposits-to-assets ratio initially boosts ROA, but the effect weakens over time. The shaded area around the line represents the confidence interval, highlighting the level of uncertainty in the estimates. After the decline, the response stabilizes at a lower value, indicating that while the shock initially has a strong effect, its impact on ROA diminishes as time moves forward. This suggests that the relationship between the deposits-to-assets ratio and ROA is short-lived, with the influence fading over time (Figure 4).
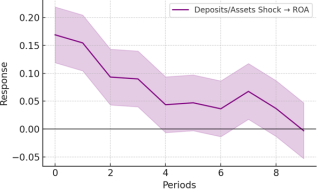
Figure 4. IRF of Deposits-to-Assets Shock on ROA.
The figure below displays the Impulse Response Functions (IRFs) showing the effects of Interest Yield and Interest Cost shocks on Profit Margin (PM) across several periods. The orange line illustrates how PM reacts to an Interest Yield shock, with an initial positive response that decreases over time. In contrast, the red line shows the impact of an Interest Cost shock on PM, starting with a negative effect but gradually improving in the following periods. The shaded areas around the lines represent the confidence intervals, highlighting the uncertainty in the estimates. This indicates that while Interest Yield shocks briefly boost PM, Interest Cost shocks initially harm PM, though the negative impact diminishes over time (Figure 5).
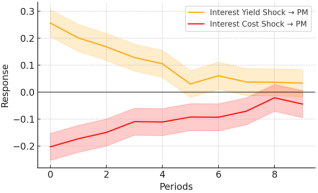
Figure 5. IRFs of Interest Yield & Cost on PM.
The IRFs show that shocks to both Capital Adequacy Ratio (CAR) and liquidity increase Non-Performing Loans (NPLs) over time, but with different intensities. A CAR shock drives a clearer, faster rise in NPLs, indicating stronger deterioration in asset quality, while a liquidity shock also raises NPLs but more gradually, implying a weaker effect. The shaded bands denote confidence intervals, so while the direction is consistently upward for both shocks, the magnitude—especially for CAR—is estimated with some uncertainty (Figure 6).
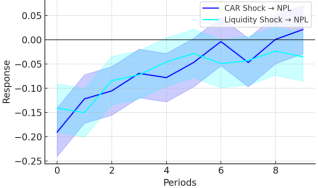
Figure 6. IRFs of CAR & Liquidity on NPLs.
4.7. Forecast Error Variance Decomposition (FEVD)
ROE declines from 75.2 at Step 1 to 48.6 at Step 10, signaling weaker profitability, while NIM improves from 10.1 to 18.4 and CAR strengthens from 5.5 to 15.7, indicating better interest margins and a more resilient capital base. The Cost/Income ratio rises from 4.2 to 10.1, pointing to deteriorating operating efficiency. NPL increases from 5.0 to 8.5 by Step 5 before easing to 7.2 at Step 10, reflecting elevated but moderating credit risk. Overall, capital and margins improve, but higher costs and persistent asset-quality pressures are weighing on returns (Table 10).
Table 10. Stepwise Evolution of Key Banking Performance Indicators.

Step

ROE

NIM

CAR

Cost/Income

NPL

1

75.2

10.1

5.5

4.2

5

5

55.3

15.6

12.1

8.5

8.5

10

48.6

18.4

15.7

10.1

7.2

Source: NBC; authors’ calculations.
ROA declines from 72.1 at Step 1 to 45 at Step 10, signaling weaker asset profitability. In contrast, NIM improves from 12.5 to 20.3 and CAR strengthens from 6 to 15.6, indicating better interest margins and a more robust capital base. Deposits/Assets also rises from 4.2 to 10, suggesting more stable, deposit-based funding. However, NPL increases from 5.2 to 9.1, pointing to elevated credit risk. Overall, banks appear stronger on capital, liquidity, and margins, but profitability is slipping and asset quality risks are building (Table 11).
Table 11. Stepwise Evolution of ROA, NIM, CAR, Deposits/Assets, and NPL.

Step

ROA

NIM

CAR

Deposits/Assets

NPL

1

72.1

12.5

6

4.2

5.2

5

52.6

18.4

13.2

8.1

7.7

10

45

20.3

15.6

10

9.1

Source: NBC; authors’ calculations.
Profitability is weakening over time: Profit Margin drops from 68.3 at Step 1 to 43.1 at Step 10. Meanwhile, revenue drivers improve—Interest Yield climbs from 10.5 to 16.8 and Non-Interest Revenue from 7.2 to 13.3—but costs rise even faster, with Interest Cost increasing from 8.7 to 14 and the Cost/Income ratio from 5.3 to 12.8. Net effect: despite higher income from both interest and non-interest sources, accelerating costs compress margins and reduce operational efficiency (Table 12).
Table 12. Stepwise Evolution of Profit Margin, Interest Yields, Costs, and Non-Interest Revenue.

Step

PM

Interest Yield

Interest Cost

Non-Int Rev

Cost/Income

1

68.3

10.5

8.7

7.2

5.3

5

50.5

15.2

12.4

11.6

10.3

10

43.1

16.8

14

13.3

12.8

Source: NBC; authors’ calculations.
From Step 1 to Step 10, core metrics trend positively: NPL falls sharply (70.5 → 48), indicating better credit quality; ROA improves (8.6 → 12.1), signaling stronger asset profitability; Liquidity rises (6.4 → 13), enhancing short-term resilience; and CAR strengthens (5.0 → 10.2), reflecting thicker capital buffers. Loan/Assets also climbs (9.5 → 16.7), consistent with more aggressive lending—supportive of earnings but raising potential risk if underwriting and monitoring don’t keep pace. Overall, profitability, credit quality, liquidity, and capital adequacy improve, with a prudent watch on rising loan intensity (Table 13).
Table 13. Stepwise Evolution of Credit Quality, Profitability, Liquidity, Capital, and Lending Intensity.

Step

NPL

ROA

Loan/Assets

Liquidity

CAR

1

70.5

8.6

9.5

6.4

5

5

54.3

10.2

14

11.5

10

10

48

12.1

16.7

13

10.2

Source: NBC; authors’ calculations.
The FEVD over a 10-step horizon shows that credit risk and buffers dominate performance dynamics: NPL explains roughly 30% of the forecast variance in both ROE and ROA, with CAR and NIM also contributing meaningfully. Profit Margin variance is driven mainly by income structure—Interest Yield, Interest Cost, and Non-Interest Revenue—highlighting pricing and fee mix as key levers. For NPL itself, Loan-to-Assets, Liquidity, and CAR are the principal drivers, underscoring how lending intensity, short-term funding strength, and capital cushions shape credit risk. Overall, NPL and CAR stand out as cross-cutting determinants of bank performance (Figure 7).
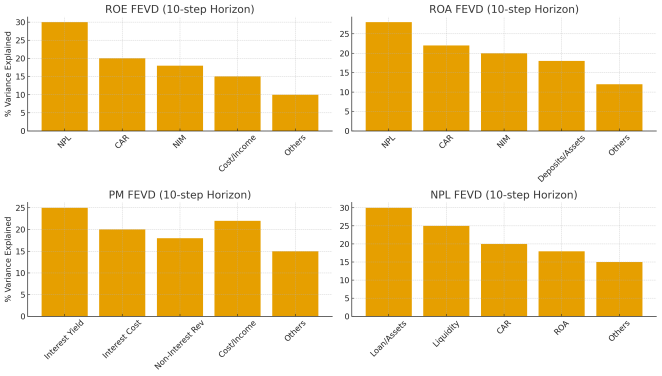
Figure 7. Forecast Error Variance Decomposition (FEVD).
4.8. Granger Causality Tests
Granger-causality results show that NPLs predict profitability, with rising NPLs leading to future profit declines, while the reverse effect (profits predicting NPLs) is weak. Capital Adequacy (CAR) and Liquidity also Granger-cause profitability, indicating that stronger capital buffers and liquidity positions help stabilize banks and support higher future earnings. Overall, credit-risk deterioration drives profits down, whereas robust capital and liquidity improve profit predictability and resilience.
4.9. Results and Discussion by Sectors and Their Impact
The study finds no strong direct link between deposits and net profit in Cambodian banks because deposits act primarily as funding, not profit drivers; profitability depends on how efficiently banks transform those deposits into productive lending—especially in high-return sectors—while intense competition for deposits compresses net interest margins. Statistically, multicollinearity between deposit and loan variables likely muted deposit effects in the PVAR, implying deposits influence profit indirectly through loan allocation and risk management rather than independently. Anticipated outcomes point to certain loan categories (e.g., retail trade, real estate) exerting stronger profit impacts than others (e.g., agriculture, mining), and to deposit type (government vs. individual) shaping how banks manage profitability and credit risk. The dataset spans 2010-2024 across banks with sectoral loan amounts and net profit, and stationarity was verified via ADF tests (p<0.05 threshold), enabling time-series modeling (Table 14).
Table 14. Augmented Dickey-Fuller (ADF) Stationarity Test Results by Sector and Net Profit.

Variable

ADF Statistic

p-value

Conclusion

Agriculture, Forestry and Fishing

-13.71

1.26e-25

Stationary

Mining and Quarrying

-25.12

0.00

Stationary

Manufacturing

-8.79

2.29e-14

Stationary

Utilities

-8.12

1.14e-12

Stationary

Construction

-3.59

0.006

Stationary

Wholesale Trade

-18.35

2.24e-30

Stationary

Retail Trade

-12.82

6.16e-24

Stationary

Hotels and Restaurants

-5.10

1.39e-05

Stationary

Personal Essentials

-4.44

2.48e-04

Stationary

Other Lending (FI, Arts, Education, Human, others)

-17.35

5.25e-30

Stationary

Net Profit

-16.50

2.14e-29

Stationary

Source: NBC; authors’ calculations.
All variables are stationary (p < 0.05), so differencing isn’t required, and the analysis can proceed with a PVAR: define variables (loan/deposit categories, net profit), choose lags via AIC/SIC, estimate the model, and use IRFs and variance decomposition to study dynamic effects. In practice, severe multicollinearity—especially among loan categories (e.g., Retail vs. Wholesale) and with net profit—caused numerical instability even after dropping highly correlated series and standardizing. PCA was then applied to reduce dimensionality (first component explained 91.8 percent of variance), which improved stability but did not fully resolve estimation issues. Given evidence of cointegration from the Johansen test (rank = 4), the workflow pivots to a VECM to capture both short-term adjustments and long-run equilibrium dynamics, with VECM estimation set as the next step.
Results from the Output:
The VECM results indicate long-run cointegration among the principal components, with PC2 and PC4 significant drivers and PC5 negative but not significant, while short-run dynamics show strong persistence via lagged effects (notably L1. PC1 and L1. PC3). To map transmission mechanisms, the plan is to use Impulse Response Functions and Variance Decomposition; however, numerical instability (likely from a singular covariance matrix) suggests switching to Generalized IRFs or adjusting parameters. The dataset was cleaned and relabeled (e.g., standardizing “Transport and Storage”) and lag specifications corrected; model selection via AIC/BIC points to an optimal lag length of 1. Accordingly, the analysis proceeds with a PVAR (1) to estimate how shocks across loan categories relate to net profit and to quantify their short- and long-run interactions.
The results for the PVAR model with lag length 1 show the relationships between the various loan categories and the net profit (as the dependent variable). For each variable, it has the following columns in the summary:
Table 15. Sectoral Loan Impact on Bank Profitability — Regression Coefficients and Significance.

Loan Category

Coefficient

Std. Error

t-stat

p-value

Interpretation

Agriculture, Forestry & Fishing

0.110378

(from model)

(from model)

0.006

Positive and significant - lending to this sector increases net profit.

Mining & Quarrying

-0.868384

(from model)

(from model)

0.033

Negative and significant - higher lending reduces profitability.

Retail Trade

-0.188927

(from model)

(from model)

0.001

Negative and strongly significant - competition and sensitivity erode profits.

Information Media & Telecom

-0.914464

(from model)

(from model)

0.000

Negative and highly significant - lending here strongly lowers profitability.

Source: NBC; authors’ calculations.
Results from the PVAR Model:
Across sectors, lending patterns map clearly to profitability: Agriculture, forestry & fishing is positively associated with net profit (coef. 0.110; p=0.006), supporting greater, well-structured exposure. In contrast, Mining & quarrying (coef. −0.868; p=0.033), Retail trade (coef. −0.189; p=0.001), and Information media & telecom (coef. −0.914; p=0.000) are linked to lower profits—consistent with commodity volatility, thin retail margins/cyclicality, and capex-heavy, fast-obsolescing telecoms. Practically, banks should tilt portfolios toward agriculture, and apply tighter underwriting, pricing, and limits—plus closer monitoring—in mining, retail, and telecom to contain downside risk while preserving selective opportunities.
Breakdown of Sectors and Their Impact on Net Profit:
Agriculture, Forestry and Fishing
Lending to the agriculture sector is positively linked to bank profitability (coef. ≈ 0.110), reflecting the sector’s steady demand and central role in economic activity. For banks, agriculture often presents comparatively lower risk—supported by recurring cash flows and, in many cases, government programs or subsidies that cushion downside—so well-structured exposure can lift net profit while maintaining prudent risk levels.
Mining and Quarrying
The mining sector shows a strong negative link to bank profitability (coef. ≈ −0.868), driven by volatile commodity prices and elevated environmental/regulatory risks that disrupt operations and strain cash flows. Given this instability, banks should be cautious—tighten underwriting, cap exposures, and adjust limits dynamically—especially during commodity downturns, balancing any potential upside against pronounced downside risk.
Retail Trade
The retail trade sector is associated with lower bank net profit (coef. ≈ −0.189), reflecting thin margins and fierce competition in categories like consumer goods and apparel, plus high cyclicality that undermines stability in downturns. To manage this risk while preserving opportunity, banks can rebalance exposure toward steadier retail sub-sectors (e.g., essentials, established franchises), tighten underwriting for volatile segments, and use granular credit standards and monitoring to price risk appropriately.
Information Media & Telecom
The information media and telecommunications sector is linked to significantly lower bank net profit (coef. ≈ −0.91), likely due to heavy capex for infrastructure and fast tech obsolescence that raises costs before returns materialize. While long-term upside exists (digital services, 5G, rising media demand), banks should lend cautiously and scrutinize firms’ financial strength and strategy. The results also show asymmetry in risk-return dynamics: credit-risk shocks strongly and persistently depress profitability, whereas profitability only weakly reduces NPLs. Solid capital and liquidity buffers help absorb shocks, and operational efficiency remains a key driver of profit margins.
5. Conclusion and Recommendations
Using a PVAR framework on Cambodian banks (2010-2024), this study shows that profitability (ROE, ROA, PM) is highly persistent, credit-risk shocks (NPLs) exert a durable drag on profits, and both capital adequacy (CAR) and liquidity buffers materially stabilize outcomes. Operating efficiency (lower Cost-to-Income) is a consistent, first-order driver of margins. Together, these dynamics confirm that durable profitability in an emerging market banking system rests on risk control, strong buffers, and disciplined cost management, not on balance-sheet expansion alone.
Sector-sensitive lending is pivotal: prioritizing resilient activities—particularly agriculture, forestry, and fishing with seasonal products and public partnerships—supports steady returns, while mining and telecommunications require tighter safeguards (collateral, risk-based pricing, rigorous project vetting). In retail, focusing on essential goods and e-commerce with cash-flow-aligned terms strengthens resilience. Across portfolios, dynamic pricing, ML-driven credit risk models, diversification, and proactive restructuring, complemented by development-bank partnerships and green/impact finance, help convert risk into sustainable earnings.
Critically, deposit growth is not a profit guarantee. Value is created by efficient deployment of funding into resilient sectors and risk-adjusted pricing in cyclical areas, while avoiding idle liquidity that dilutes returns.
Limitations & Future Research. This study is subject to several methodological limitations. First, the use of a PVAR framework—while effective for capturing dynamic interactions—relies on relatively short annual panels, which may constrain the precision of System-GMM estimation and increase sensitivity to instrument count and lag selection. Second, the model assumes linear relationships among banking variables, whereas profitability-risk dynamics may exhibit nonlinear or threshold effects not captured by the specification. Third, the PVAR uses internal instruments derived from lagged variables, which may be weak when persistence is high, potentially affecting identification. Fourth, fixed effects are removed through Helmert transformation, which improves instrument validity but limits the ability to analyze time-invariant structural characteristics of banks. Finally, data availability restricts the inclusion of more granular risk, liquidity, and sectoral exposure variables, which may omit relevant channels of profitability transmission.
The weak direct deposit-profit link may partly reflect model constraints and deposit-loan collinearity. Future work should incorporate deposit pricing/competition, liquidity buffer design, and macroeconomic shocks, and test alternative estimators to trace indirect channels (deposits → margins → profits). A deeper look at how deposit competition shapes NIM would sharpen the deposit-profitability nexus for Cambodia and comparable economies.
Policy & Managerial Implications. Make NPL management a front-line priority (stricter classification, timely restructuring, collateral enforcement). Keep CAR robust and pair it with liquidity requirements to cushion profitability and asset-quality shocks. Push operational efficiency through risk-based management, digital process automation, and cost optimization. Supervisors should foreground credit-risk monitoring, capital strength, and cost efficiency in macroprudential policy—moving beyond reliance on earnings to cleanse NPLs and toward upstream loan-quality improvement.
In sum, resilient profitability in Cambodia’s banking sector hinges on curbing credit risk, maintaining purposeful buffers, pricing commensurate with risk and funding costs, and driving operational efficiency—rather than on sheer asset growth.
Abbreviations

ADF

Augmented Dickey-Fuller

AIC

Akaike Information Criterion

AR (1), AR (2)

First-order / Second-order Autoregressive term

BIC

Bayesian Information Criterion

CAR

Capital Adequacy Ratio

FEVD

Forecast Error Variance Decomposition

FI(s)

Financial Institution(s)

GMM

Generalized Method of Moments

HQIC

Hannan-Quinn Information Criterion

IRF / IRFs

Impulse Response Function(s)

LLC

Levin-Lin-Chu (panel unit-root test)

ML

Machine Learning

NBC

National Bank of Cambodia

NIM

Net Interest Margin

NPL / NPLs

Non-Performing Loan(s)

PCA

Principal Component Analysis

PC1, PC2, …

Principal Component 1, 2, etc.

PM

Profit Margin

PVAR

Panel Vector Autoregression

ROA

Return on Assets

ROE

Return on Equity

Std. Dev.

Standard Deviation

VAR

Vector Autoregression

VECM

Vector Error Correction Model

Author Contributions
Dy Davuth: Conceptualization, Data curation, Methodology, Writing – original draft
Manaranjan Behera: Conceptualization, Methodology, Writing – review & editing
Funding
This work is not supported by any external funding.
Data Availability Statement
The data is available from the corresponding author upon reasonable request.
The data supporting the outcome of this research work has been reported in this manuscript.
Conflicts of Interest
The authors declare no conflicts of interest.
References
[1] Athanasoglou, P., Brissimis, S., Delis, M. Bank-specific, industry-specific and macroeconomic determinants of bank profitability. Journal of International Financial Markets, Institutions & Money. 2008, 18(2), 121-136. HYPERLINK "
[2] Kohlscheen, E., Murcia, A., Contreras, J. Determinants of bank profitability in emerging markets. BIS Working Papers. 2018, (686), 1-39.
[3] Bolívar, F., Durán, M. A., Lozano-Vivas, A. Business model contributions to bank profit performance: A machine learning approach. arXiv. 2024, 2401.12334. HYPERLINK "
[4] Azzabi, A., Lahrichi, Y. Bank performance determinants: State of the art and future research avenues. arXiv. 2023, 2311.08617. HYPERLINK "
[5] Obeid, R. Factors affecting net interest margin in the banking sector: Evidence from the Arab region. Journal of Governance & Regulation. 2024, 13(1), 214-222. HYPERLINK "
[6] Saif-Alyousfi, A. Determinants of bank profitability: Evidence from 47 Asian countries. Journal of Economic Studies. 2020, 49(1), 44-60. HYPERLINK "
[7] Goddard, J., Liu, H., Molyneux, P., Wilson, J. The profitability of European banks: A cross-sectional and dynamic panel analysis. The Manchester School. 2013, 81(1), 66-89. HYPERLINK "
[8] Horobet, A., Radulescu, M., Belascu, L., Dita, S. Determinants of bank profitability in CEE countries: Evidence from GMM panel data estimates. Journal of Risk and Financial Management. 2021, 14(7), 307. HYPERLINK "
[9] Jerahun, E., Davis, R., Preece, R. Regulation, monetary policy, and bank profitability. Journal of Financial Stability. 2022, 63, 100968. HYPERLINK "
[10] Klein, N. Profitability and balance sheet repair of EU banks. IMF Working Papers. 2013, WP/13/216, 1-28.
[11] Haris, M., Khan, M. A., Tanveer, M. The impact of liquidity risk and credit risk on bank profitability: Evidence from COVID-19 period. PLOS ONE. 2024, 19(8), e0308356. HYPERLINK "
[12] Ghenimi, A., Chaibi, H., Omri, M. The effects of liquidity risk and credit risk on bank stability. Journal of Economics and Business. 2020, 112, 105939. HYPERLINK "
[13] Trinh, V., Tan, K. Bank profit persistence: Evidence from emerging Asia. Finance Research Letters. 2022, 48, 102982. HYPERLINK "
[14] Sahoo, B., Mishra, P. A machine learning approach to bank profitability determinants. Expert Systems with Applications. 2024, 238, 121781. HYPERLINK "
[15] Chand, A., Somnath, S., Ali, M. Determinants of bank profitability in island economies. Journal of Risk and Financial Management. 2024, 17(6), 218. HYPERLINK "
[16] Ahmed, F. Cambodia’s Banking Sector. Washington, DC: International Monetary Fund; 2023, pp. 1-20.
[17] YCP Group. Declining profitability in Cambodia’s banks: The impact of rising costs and NPLs. Available from:
[18] The impact of increased liquidity on profitability: Insights from Cambodian commercial banks. Banks and Bank Systems. 2025, 20(2), 38-50. HYPERLINK "
[19] Dinger, V., Hagen, J. Excess liquidity and bank performance. International Review of Economics & Finance. 2022, 80, 152-168. HYPERLINK "
[20] Bunda, I., Desquilbet, J. Too much liquidity? Evidence from African banks. Economic Modelling. 2020, 93, 179-190. HYPERLINK "
[21] Lim, S., Barnett, C. Commercial banks’ profitability determinants in Cambodia: Fixed effect and random effect estimation. CamEd Business Journal. 2020, 5(1), 69-82.
[22] Maaji, M. M., Barnett, C., Long, C. Non-performing loans and commercial bank profitability: Evidence from Cambodia. Journal of Entrepreneurship and Business Innovation. 2023, 10(2), Article 2. HYPERLINK "
[23] Acar Balaylar, N., Karimli, T., Bulut, A. The effect of non-interest income on bank profitability and risk: Evidence from Turkey. Revista Galega de Economía. 2025, 34(1), 1-23. HYPERLINK "
[24] Klein, P. O., Weill, L. Bank profitability and economic growth. Research in International Business and Finance. 2022, 60, 101727. HYPERLINK "
[25] Pasiouras, F., Kosmidou, K. Factors influencing the profitability of domestic and foreign commercial banks in the EU. Research in International Business and Finance. 2007, 21(2), 222-237. HYPERLINK "
[26] Holtz-Eakin, D., Newey, W., Rosen, H. Estimating Vector Autoregressions with Panel Data. Econometrica. 1988, 56(6), 1371-1395. HYPERLINK "
Cite This Article
  • APA Style

    Davuth, D., Behera, M. (2025). Dynamic Determinants of Bank Profitability in Cambodia: Evidence from Panel Var Analysis. International Journal of Finance and Banking Research, 11(6), 129-142. https://doi.org/10.11648/j.ijfbr.20251106.12

    Copy | Download

    ACS Style

    Davuth, D.; Behera, M. Dynamic Determinants of Bank Profitability in Cambodia: Evidence from Panel Var Analysis. Int. J. Finance Bank. Res. 2025, 11(6), 129-142. doi: 10.11648/j.ijfbr.20251106.12

    Copy | Download

    AMA Style

    Davuth D, Behera M. Dynamic Determinants of Bank Profitability in Cambodia: Evidence from Panel Var Analysis. Int J Finance Bank Res. 2025;11(6):129-142. doi: 10.11648/j.ijfbr.20251106.12

    Copy | Download

  • @article{10.11648/j.ijfbr.20251106.12,
      author = {Dy Davuth and Manaranjan Behera},
      title = {Dynamic Determinants of Bank Profitability in Cambodia: Evidence from Panel Var Analysis},
      journal = {International Journal of Finance and Banking Research},
      volume = {11},
      number = {6},
      pages = {129-142},
      doi = {10.11648/j.ijfbr.20251106.12},
      url = {https://doi.org/10.11648/j.ijfbr.20251106.12},
      eprint = {https://article.sciencepublishinggroup.com/pdf/10.11648.j.ijfbr.20251106.12},
      abstract = {This study investigates the dynamic determinants of bank profitability in Cambodia using a Panel Vector Autoregression (PVAR) framework covering commercial banks from 2010 to 2024. Profitability—measured through Return on Equity (ROE), Return on Assets (ROA), and Profit Margin (PM)—is examined as a systemic outcome shaped by interactions with credit risk (Non-Performing Loans (NPLs)), intermediation efficiency (Net Interest Margin, NIM), and capital strength (Capital Adequacy Ratio, CAR), alongside funding structure and operational efficiency. Descriptive evidence shows that Cambodian banks remain moderately profitable but face rising cost pressures and uneven risk governance. Correlation patterns confirm profitability’s sensitivity to credit quality, cost efficiency, and capital buffers. Panel Vector Autoregression (PVAR) estimation reveals that profitability is highly persistent, with strong positive effects from lagged returns, interest margins, and capitalization, while higher NPLs and elevated cost-to-income ratios significantly depress earnings. Liquidity and deposit-based funding provide stability but generate diminishing marginal returns when excessive. Impulse Response Functions highlight that credit-risk shocks have immediate and persistent negative effects on profitability, whereas capital and liquidity shocks initially stabilize returns before gradually tapering. Forecast Error Variance Decomposition shows that NPLs, CAR, and NIM are the dominant drivers of profitability dynamics, emphasizing the centrality of risk control, capital adequacy, and pricing strength. A sectoral extension shows that lending to agriculture contributes positively to net profit, while exposure to mining, retail trade, and telecommunications reduces profitability due to volatility, narrow margins, and high capital intensity. Granger-causality tests reinforce that credit risk, capital buffers, and liquidity positions predict future profitability more strongly than the reverse. Overall, the results demonstrate that durable bank profitability in Cambodia depends not on balance-sheet expansion alone but on prudent credit-risk management, efficient intermediation, disciplined cost control, and targeted sectoral lending. These findings offer practical insights for bank executives and policymakers seeking to strengthen financial stability and optimize risk-adjusted returns in an evolving banking landscape.},
     year = {2025}
    }
    

    Copy | Download

  • TY  - JOUR
    T1  - Dynamic Determinants of Bank Profitability in Cambodia: Evidence from Panel Var Analysis
    AU  - Dy Davuth
    AU  - Manaranjan Behera
    Y1  - 2025/12/17
    PY  - 2025
    N1  - https://doi.org/10.11648/j.ijfbr.20251106.12
    DO  - 10.11648/j.ijfbr.20251106.12
    T2  - International Journal of Finance and Banking Research
    JF  - International Journal of Finance and Banking Research
    JO  - International Journal of Finance and Banking Research
    SP  - 129
    EP  - 142
    PB  - Science Publishing Group
    SN  - 2472-2278
    UR  - https://doi.org/10.11648/j.ijfbr.20251106.12
    AB  - This study investigates the dynamic determinants of bank profitability in Cambodia using a Panel Vector Autoregression (PVAR) framework covering commercial banks from 2010 to 2024. Profitability—measured through Return on Equity (ROE), Return on Assets (ROA), and Profit Margin (PM)—is examined as a systemic outcome shaped by interactions with credit risk (Non-Performing Loans (NPLs)), intermediation efficiency (Net Interest Margin, NIM), and capital strength (Capital Adequacy Ratio, CAR), alongside funding structure and operational efficiency. Descriptive evidence shows that Cambodian banks remain moderately profitable but face rising cost pressures and uneven risk governance. Correlation patterns confirm profitability’s sensitivity to credit quality, cost efficiency, and capital buffers. Panel Vector Autoregression (PVAR) estimation reveals that profitability is highly persistent, with strong positive effects from lagged returns, interest margins, and capitalization, while higher NPLs and elevated cost-to-income ratios significantly depress earnings. Liquidity and deposit-based funding provide stability but generate diminishing marginal returns when excessive. Impulse Response Functions highlight that credit-risk shocks have immediate and persistent negative effects on profitability, whereas capital and liquidity shocks initially stabilize returns before gradually tapering. Forecast Error Variance Decomposition shows that NPLs, CAR, and NIM are the dominant drivers of profitability dynamics, emphasizing the centrality of risk control, capital adequacy, and pricing strength. A sectoral extension shows that lending to agriculture contributes positively to net profit, while exposure to mining, retail trade, and telecommunications reduces profitability due to volatility, narrow margins, and high capital intensity. Granger-causality tests reinforce that credit risk, capital buffers, and liquidity positions predict future profitability more strongly than the reverse. Overall, the results demonstrate that durable bank profitability in Cambodia depends not on balance-sheet expansion alone but on prudent credit-risk management, efficient intermediation, disciplined cost control, and targeted sectoral lending. These findings offer practical insights for bank executives and policymakers seeking to strengthen financial stability and optimize risk-adjusted returns in an evolving banking landscape.
    VL  - 11
    IS  - 6
    ER  - 

    Copy | Download

Author Information
  • Department of Academic Affairs, Build Bright University, Phnom Penh, Cambodia

    Biography: Dy Davuth serves as Senior Vice President of Academic Affairs at Build Bright University, where he has dedicated over 20 years, contributing as an Associate Professor of finance, data science and curriculum development with several research projects and numerous publications on finance and education. A prominent member of the Doctoral Evaluation Committee, he has presented at international conferences on Cambodia’s financial and educational researches. With 27 years of experience in senior management and as an independent board director for leading financial institutions like Hattha Bank and Amret MFI, Dr. Dy Davuth has also been a consultant for organizations such as ADB, KFW, the EU, and the World Bank, specializing in financial specialist and curriculum development specialist. Academically, he holds a Ph.D. in Banking and Finance, an MBA, and professional skills in AI engineering, data science, and machine learning, highlighting his expertise in finance, education, AI, and machine learning. Further, he was an individual shareholder of a leading MFI Hatta Kaksekar Ltd for 13 years.

  • School of Doctoral Studies, Build Bright University, Phnom Penh, Cambodia

    Biography: Manaranjan Behera serves as a Professor and Senior Dean at the School of Doctoral Studies and Faculty of Arts, Humanities and Languages at Build Bright University, Cambodia. He holds a Ph.D. in Analytical and Applied Economics from Utkal University, India. Currently, he is the Chief Editor of the International Journal of Business and Development Research (IJBDR), published by Build Bright University. With over 28 years of experience in research, teaching, and university management, Dr. Behera has made significant contributions to academia.

  • Abstract
  • Keywords
  • Document Sections

    1. 1. Introduction
    2. 2. Objectives of the Study
    3. 3. Methodology
    4. 4. Results and Discussion
    5. 5. Conclusion and Recommendations
    Show Full Outline
  • Abbreviations
  • Author Contributions
  • Funding
  • Data Availability Statement
  • Conflicts of Interest
  • References
  • Cite This Article
  • Author Information